A visible centerpiece for premium rooms, retreats, spas, and private wellness suites.
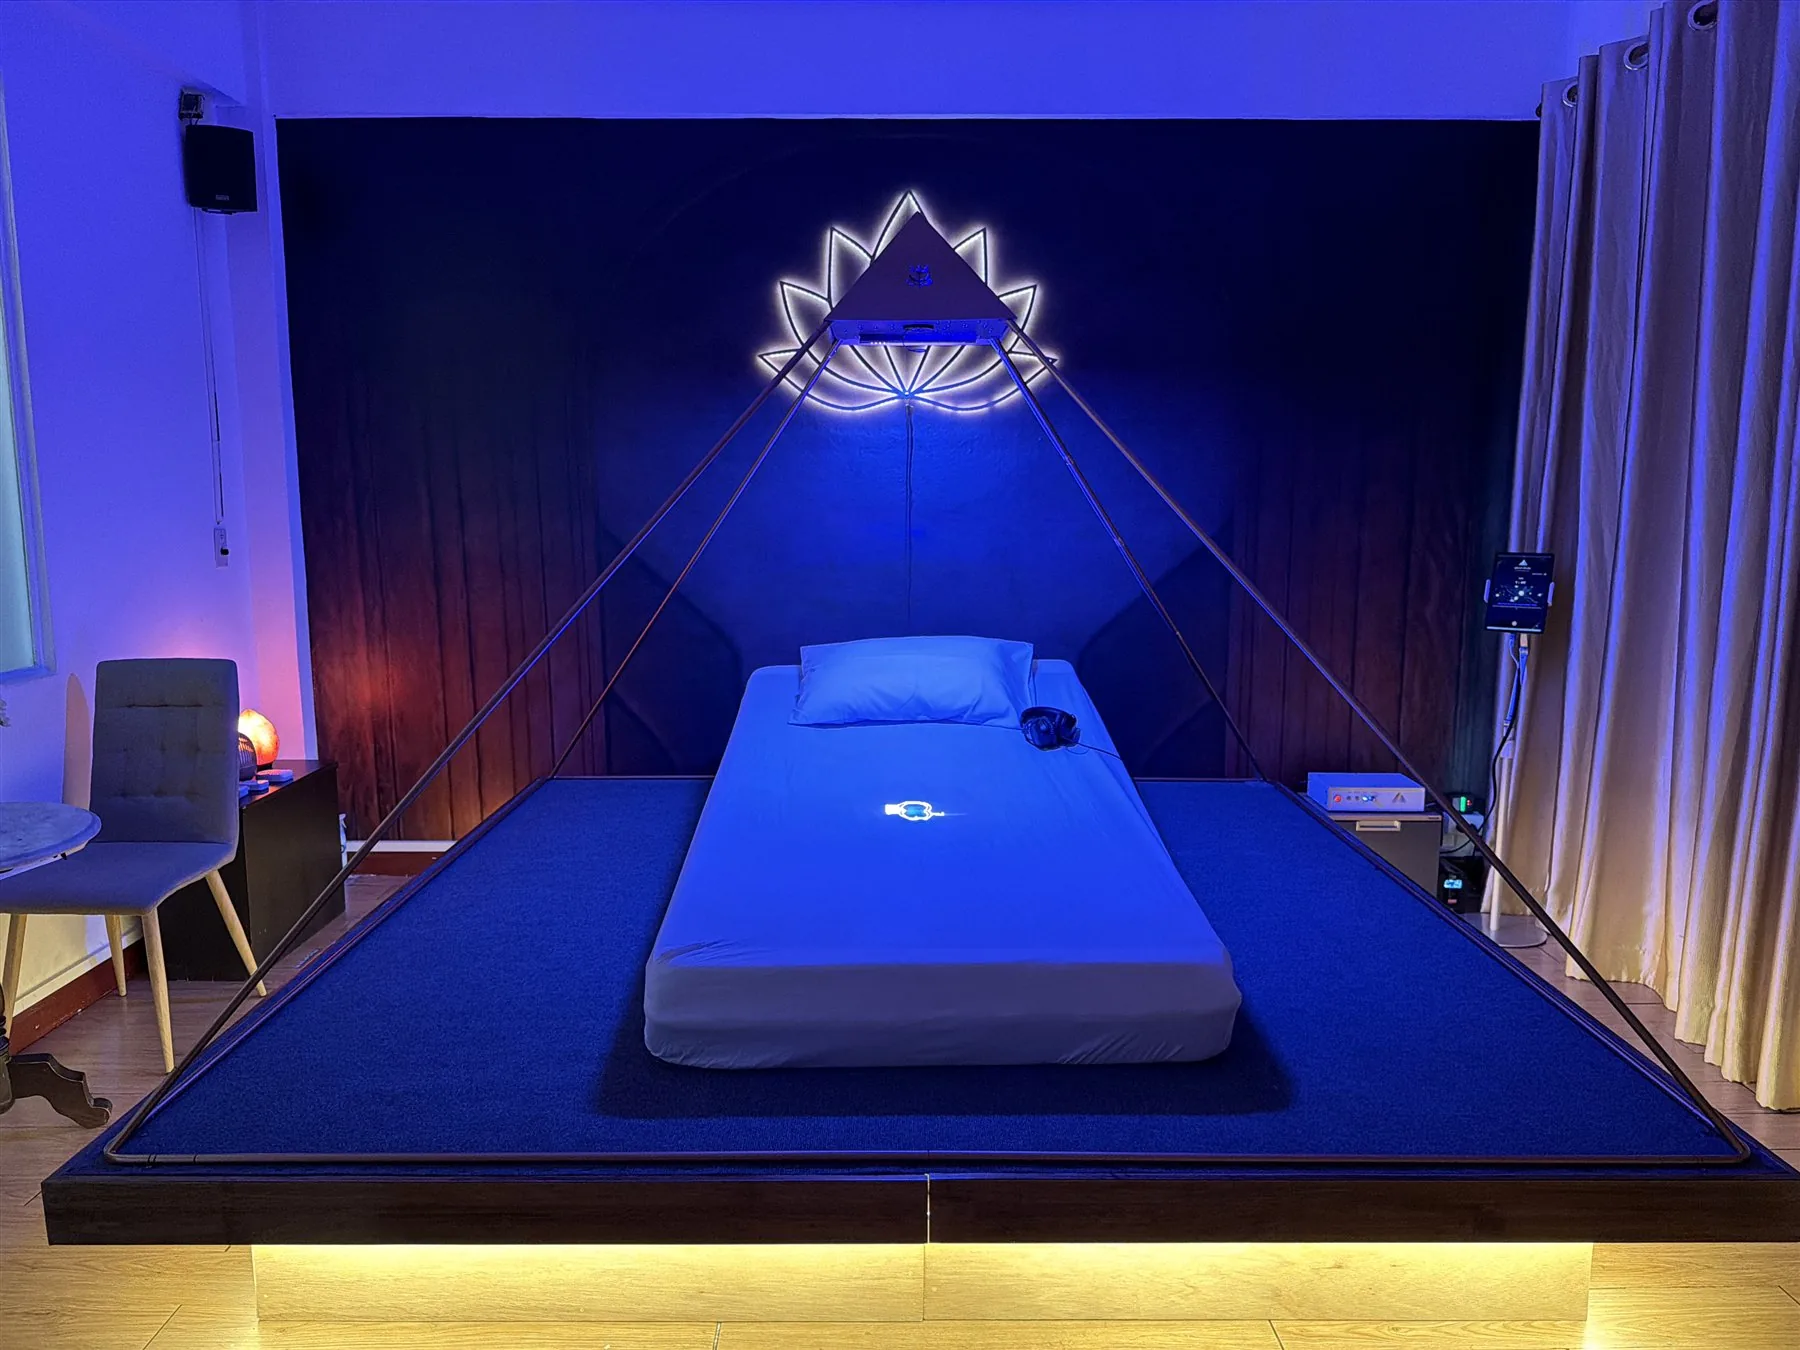
The flagship Light Mandalas experience
Luminara Pyramid
Light, sound and a guided moment of calm.
A complete wellness center offer, with setup and operator training.
- 8 synchronized technologies
- 78 Bio-Resonant Codes
- Current center network
More than a device.
A reason to visit.
Inside the experience
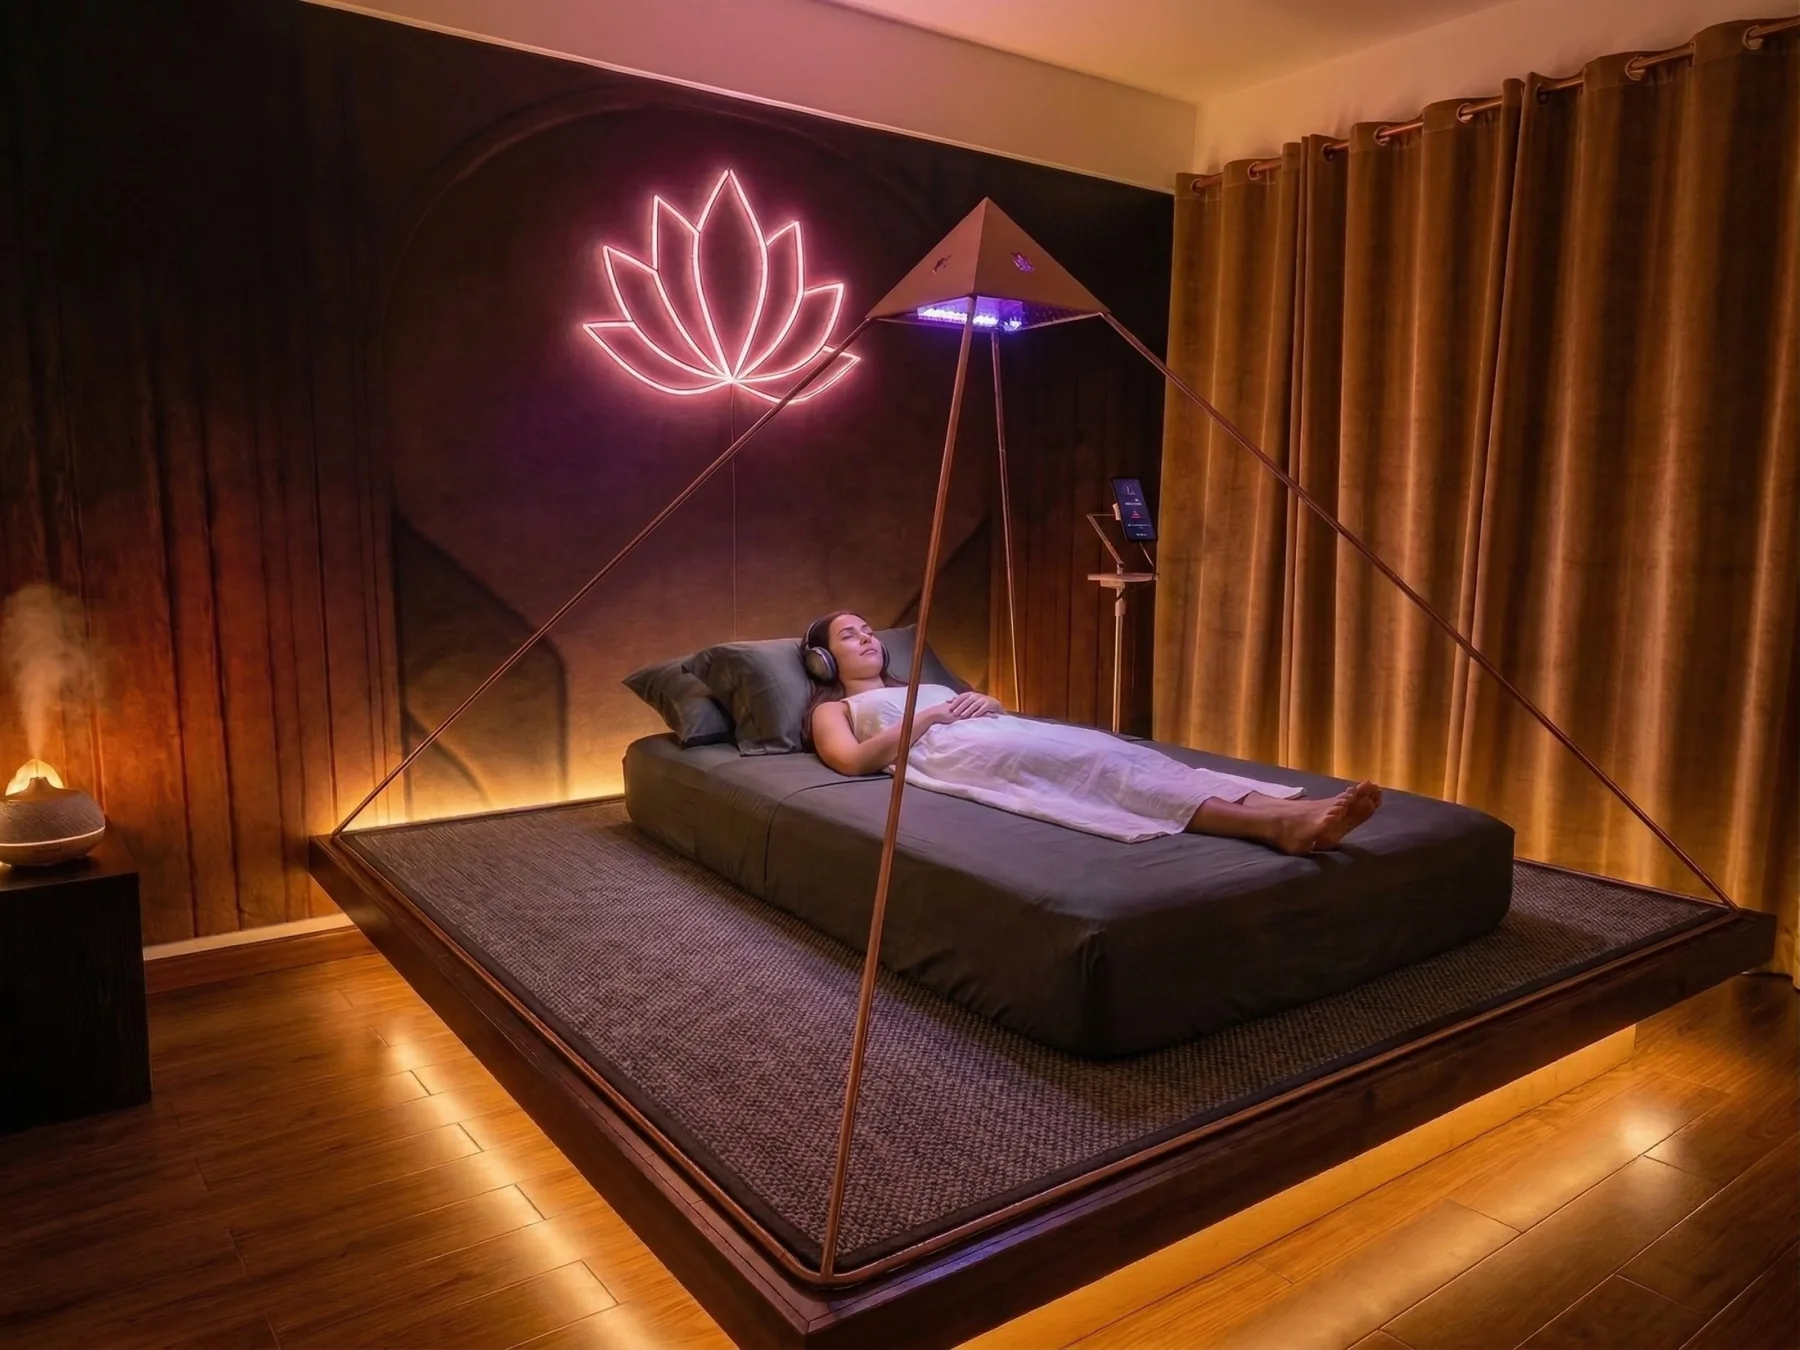
Luminara Pyramid is the flagship immersive integration system within the Light Mandalas ecosystem. It brings Bio-Resonant Codes, color light, near-infrared projection, field-informed architecture, resonance coils, grounding, and guided voice into one synchronized light-sound-field environment.
For a wellness center, retreat, spa, hospitality group, practitioner, or private owner, Luminara becomes a signature environment: visually distinctive, deeply experiential, operationally repeatable, and adaptable to a wide range of non-medical wellness intentions.
The intention is not to force a state. It is to create clear, ordered conditions in which a person can pause, settle, reconnect, and move toward greater coherence at their own pace.
- Pause
- Settle
- Regulate
- Reconnect
How Luminara works
Eight Technologies. One Coherent Chamber.
-
Programming library
Bio-Resonant Codes
A library of 78 structured acoustic resonance signatures provides the foundational program language for Luminara sessions. Codes are organized around functional wellness themes and selected through practitioner interpretation, session goals, and optional scan-informed guidance.
-
Full-spectrum atmosphere
Light modulation
High-resolution RGB lighting is synchronized with sound and resonance programming to create dynamic visual guidance. The color environment helps the guest feel immersed, oriented, and held without assigning guaranteed biological effects to individual colors.
-
Photonic geometry
RGB & near-infrared projection
Visible red, green, and blue laser projection can combine with near-infrared output to create structured visual and sensory inputs. In public language, this layer is presented as photonic immersion and geometry-led atmosphere, with careful attention to comfort and parameters.
-
Field organization
Coherence field antenna
A scalar-informed resonance interface complements the acoustic, photonic, electromagnetic, and crystalline layers. It is described as part of Light Mandalas' integrative coherence model rather than as an established medical mechanism.
-
Electromagnetic rhythm
Low-intensity PEMF modulation
Gentle pulsed electromagnetic modulation can be synchronized with the selected session program. It contributes to the immersive field architecture while remaining framed as supportive wellness technology.
-
Carrier and modulation
Resonance field coils
Coil assemblies help create the carrier and modulation architecture for the session environment. The field-generation and modulation roles are coordinated with light, sound, PEMF, and code programming.
-
Stability layer
Grounding & integration
Grounding strategies support comfort, presence, and a smooth transition during and after the session. This layer helps the experience feel embodied rather than purely sensory.
-
Human direction
Functional voice guidance
Spoken affirmations, guided imagery, breathing cues, and intention-based coaching can sit inside the session design. The voice layer reinforces relaxation, emotional steadiness, and cognitive integration without promising subconscious control or guaranteed change.
The session journey
From Arrival to Integration
A simple, guided sequence creates space for personalization without making the experience feel clinical.
Arrival and settling
A quiet transition from the outside environment into a more receptive pace.
Optional Biomatrix Scan
A wellness-oriented view of current stress, recovery, adaptation, and regulation patterns.
Wellness interpretation
The practitioner considers the assessment alongside goals, sensitivity, and session context.
Personalized selection
Appropriate themes and Bio-Resonant Codes are organized with AI-assisted decision support.
Immersive experience
Sound, light, projection, field-informed inputs, affirmations, and grounding are coordinated.
Grounding and integration
Time is provided to reconnect with the body and allow the experience to settle.
Feedback and guidance
The practitioner listens to the response and offers proportionate follow-up guidance.
What users may experience
- A deeper sense of calm
- Mental quiet and meditative depth
- Emotional settling
- A clearer, more focused state
- Restorative rest and renewed energy
- Groundedness and internal harmony
- Greater readiness for reflection
- A sense of whole-system coherence
Experiences vary between individuals. Luminara supports conditions for wellness and reflection; it does not promise a specific response or outcome.
Depth is introduced progressively.
Session frequency should reflect individual response, sensitivity, goals, and practitioner guidance. First-time users may benefit from more recovery time between sessions, while sensitive or depleted users may need a gentler pace.
Rest, hydration, quiet reflection, and unhurried movement can support post-session integration.
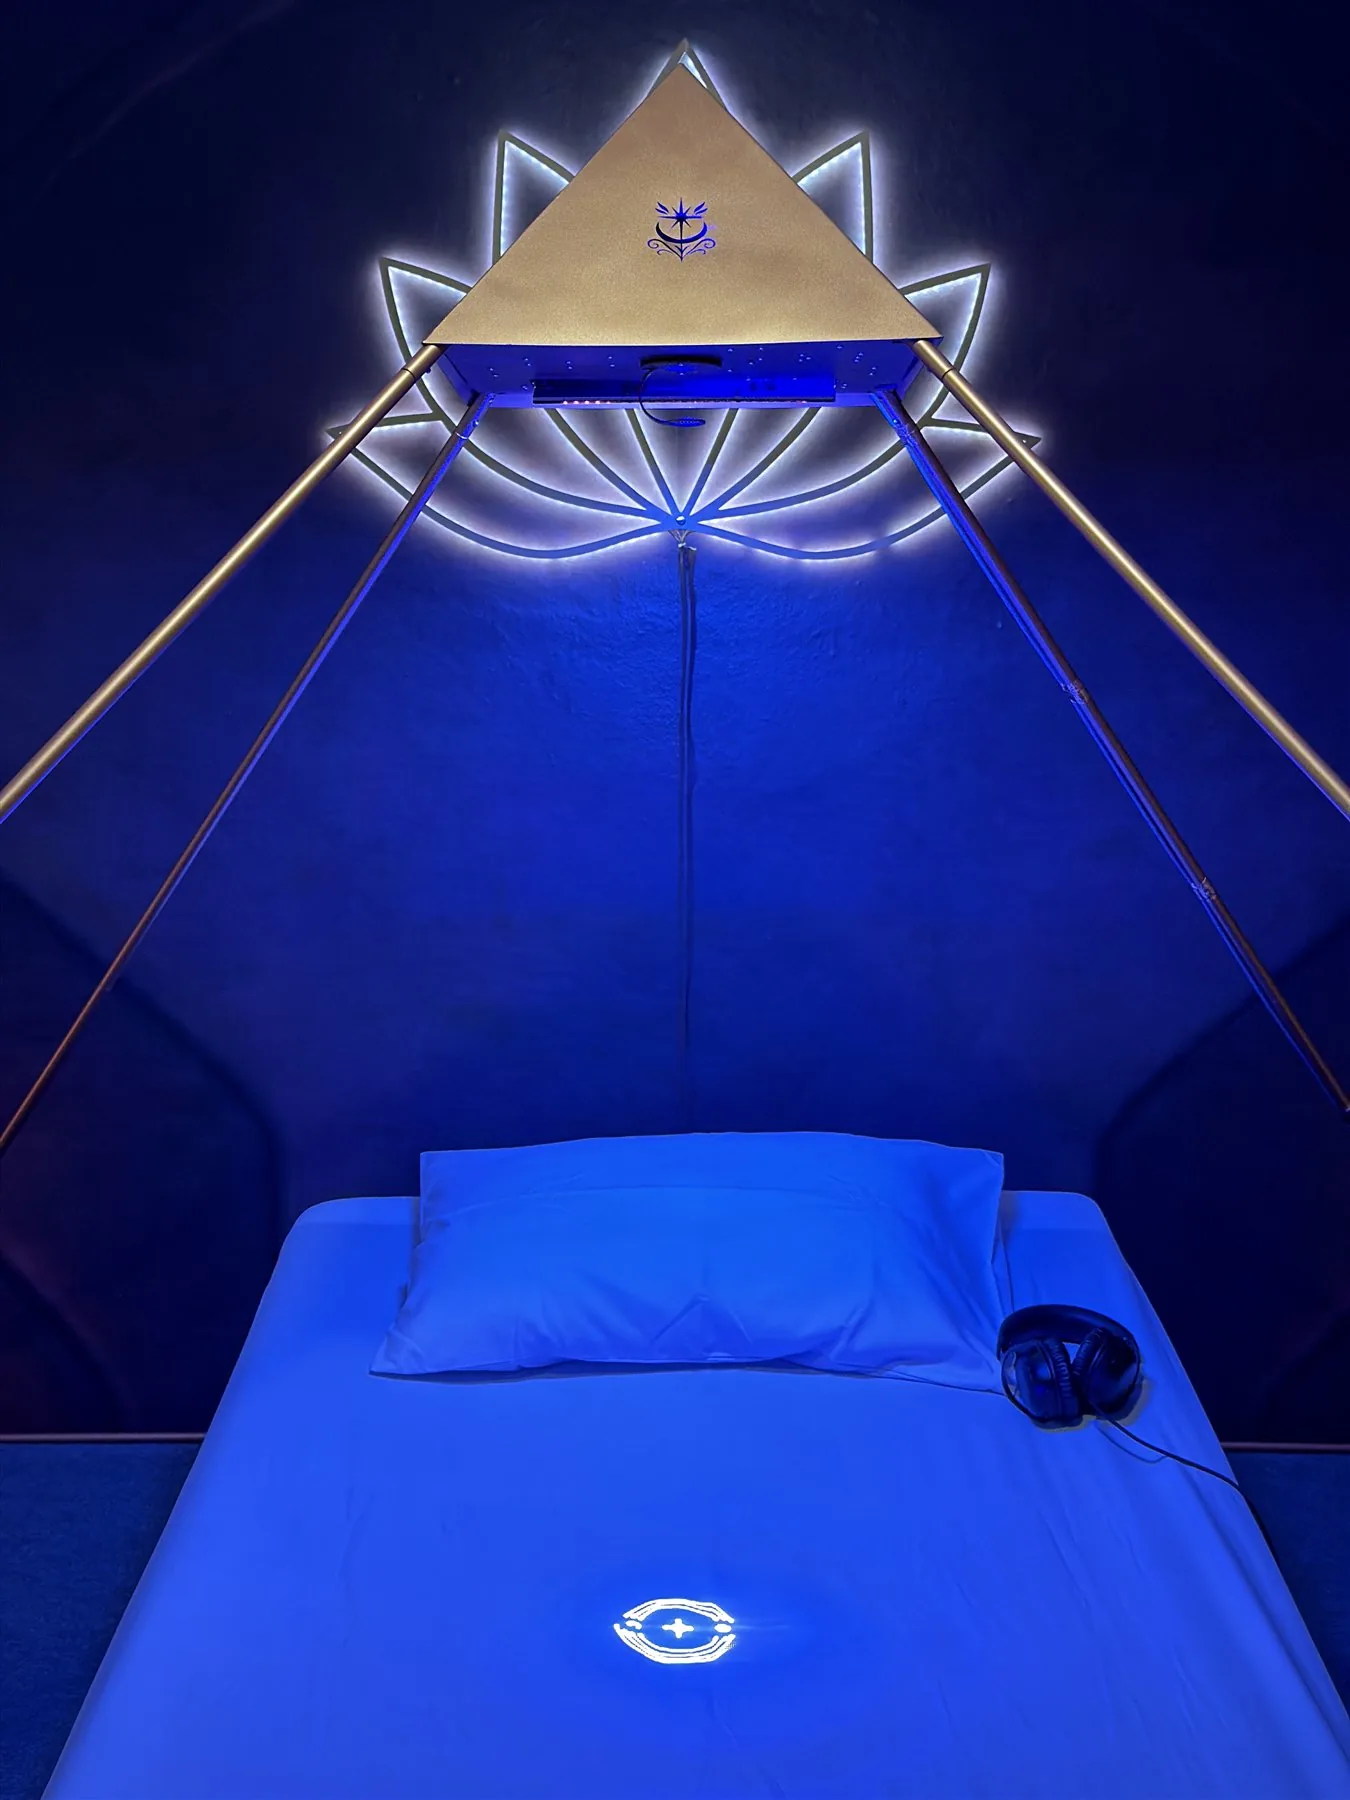
78Bio-Resonant Codes
78 pathways for personalized session design.
Codes may be selected according to session goals and scan-informed guidance, then represented through coordinated sound, light, and field-informed outputs.
- Calm & Regulation
- Rest & Circadian Support
- Emotional Balance
- Energy & Vitality
- Focus & Mental Clarity
- Recovery & Restoration
- Hydration & Flow
- Resilience & Adaptation
- Connection & Social Ease
- Integration & Grounding
How the codes are designed
Luminara's 78 Bio-Resonant Codes are structured acoustic resonance programs inspired by biological and molecular references and translated into coordinated wellness-oriented signal patterns. They are designed around functional wellness themes - not public medical, biochemical, or disease targets.
- Identity core
- Defines the intended wellness theme and the reference identity behind the program.
- Functional dynamics
- Translates that reference into movement, rhythm, color, sound, and geometric behavior.
- Field stabilization
- Keeps the output ordered so the session feels contained, coherent, and easy to follow.
- Calm & Regulation
- A quieter pace for stepping away from sensory and emotional overload.
- Rest & Circadian Support
- A gentle evening or restoration-oriented session direction.
- Emotional Balance
- A reflective setting for settling, self-awareness, and inner steadiness.
- Energy & Vitality
- A more activating theme for presence, readiness, and renewed momentum.
- Focus & Mental Clarity
- A focused internal environment for reducing noise and supporting attention.
- Recovery & Restoration
- Protected downtime after demanding work, travel, training, or life intensity.
- Hydration & Flow
- A body-awareness theme centered on ease, rhythm, and a sense of flow.
- Resilience & Adaptation
- Supportive session design for periods of change, demand, or transition.
- Connection & Social Ease
- A gentle theme for openness, comfort, reflection, and relational presence.
- Integration & Grounding
- A settling pathway that emphasizes embodiment and post-session stability.
Try the Bio-Resonant Code demo
Let visitors visualize the code before they book.
The public Luminara Pyramid Demonstration is a five-minute, non-personalized audio-light reset. It gives curious visitors a simple way to understand how a code sequence can feel: rhythm, color, sound, and intention moving through a guided arc.
- Code 21
Regulation
A soft entry for rhythm settling, restoration, and a calm opening.
- Code 50
Emotional Warmth
A nurturing phase for safety, kindness, connection, and emotional softening.
- Code 07
Stabilizing Support
A steadying center for smoothing, inner balance, and grounded refresh.
- Code 37
Mood & Clarity Support
A gentle brightness point for calm focus and emotional lightness.
- Code 38
Integration
A mood-rest bridge that closes with refreshed calm.
The demo is intentionally modest and responsible. A full Luminara session is still a practitioner-led room experience, especially when optional Biomatrix insight, guest goals, and comfort pacing are part of the journey.
Biomatrix + AI-assisted guidance
Personalization with a human at the center.
- Scan
- Interpret
- Design
- Deliver
- Reassess
- Adapt
How personalization works
Biomatrix Scan is included with the Luminara Pyramid system and is not sold separately. An optional Biomatrix Scan offers a wellness-oriented functional view of patterns related to stress, recovery, adaptation, and regulation. It helps organize session priorities and gives the practitioner a clearer starting point. It is not a medical diagnosis.
AI-assisted logic can then help structure the information, surface appropriate themes, and support Bio-Resonant Code and protocol organization. This is practitioner decision support—not autonomous medical AI, and never a replacement for practitioner judgment.
This closed-loop approach helps reduce practitioner guesswork, supports a consistent session-design process, and makes space for feedback and thoughtful adaptation over time.
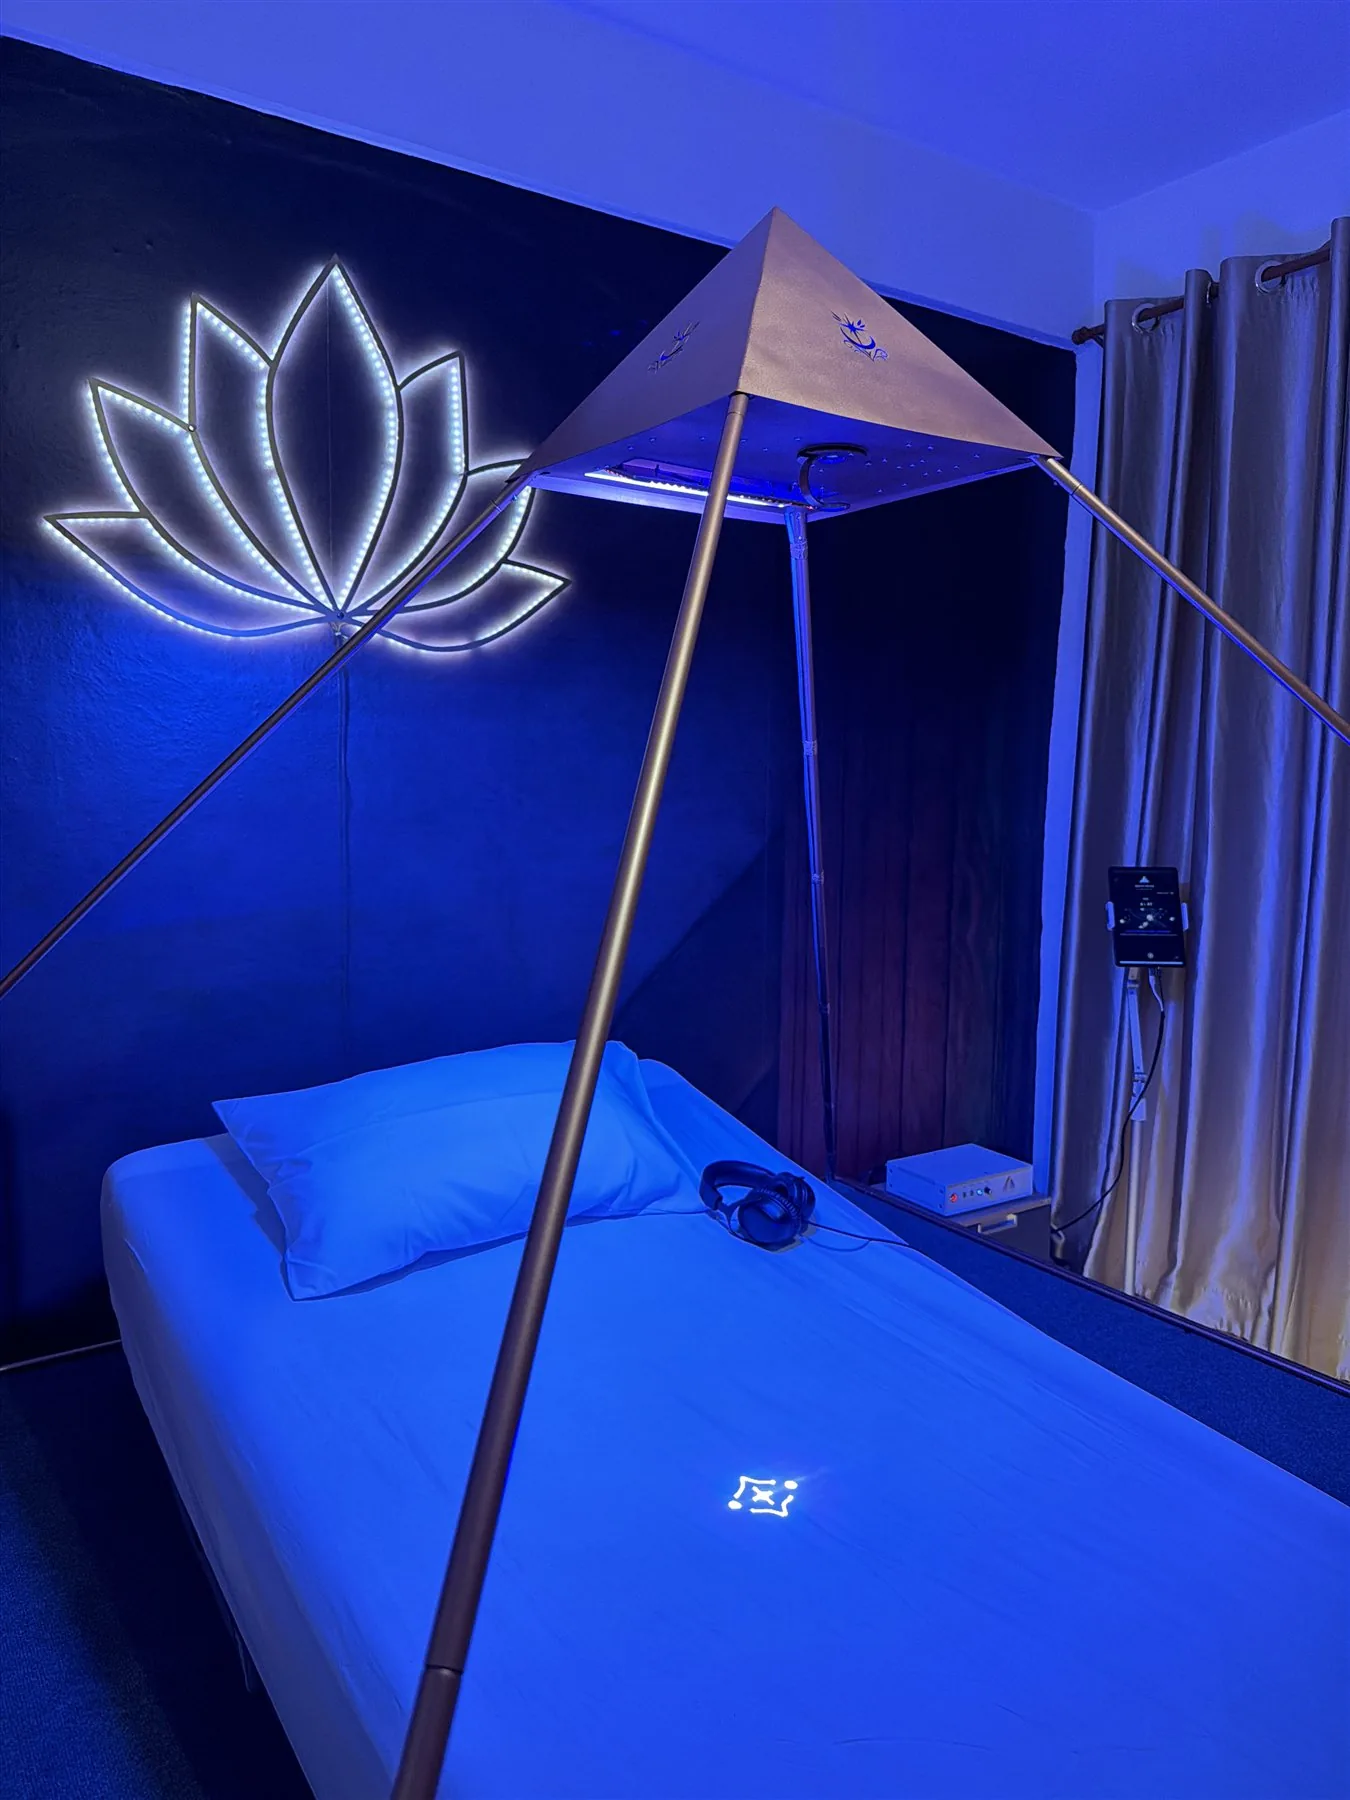
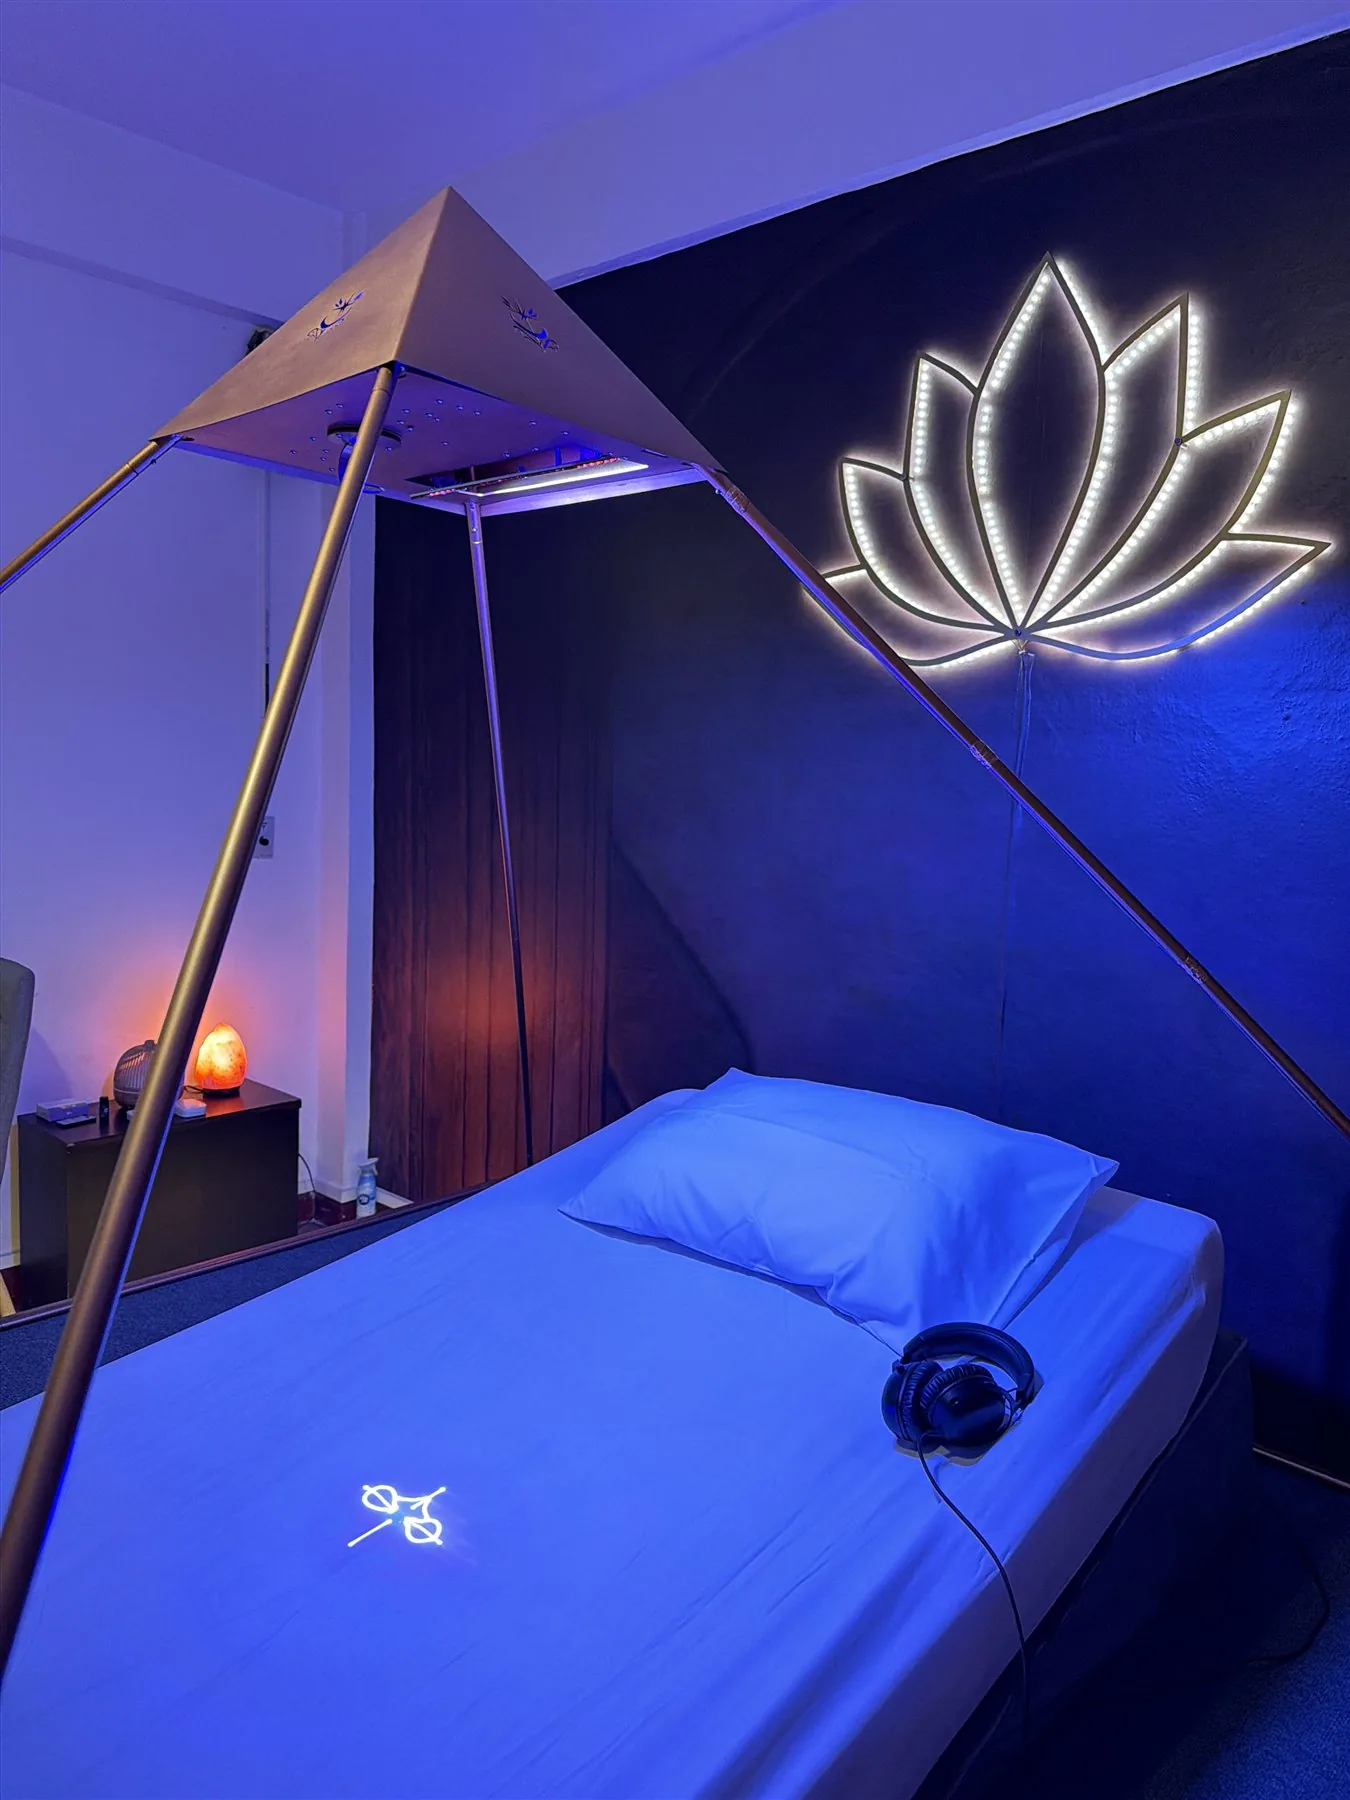
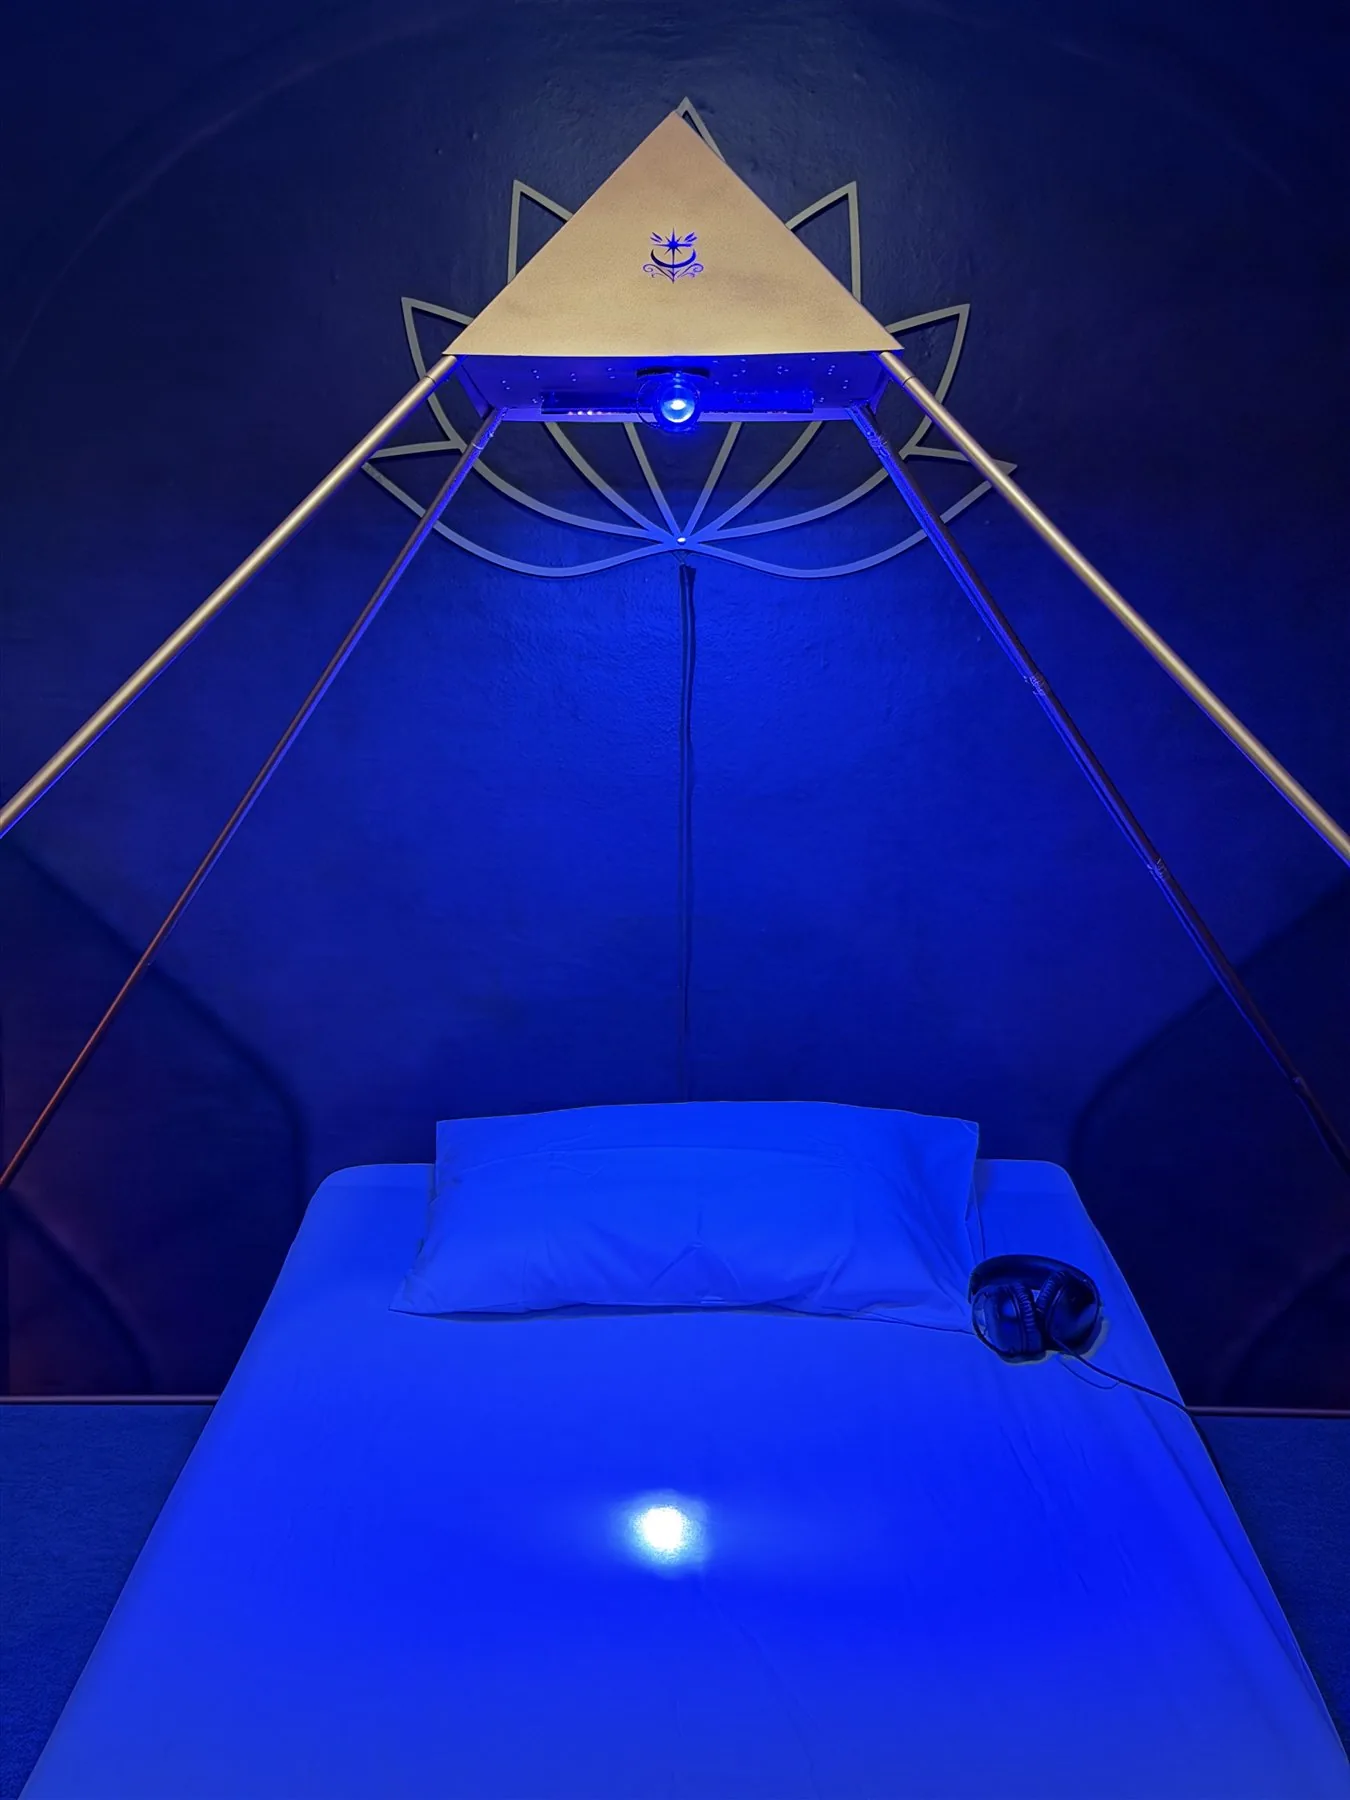
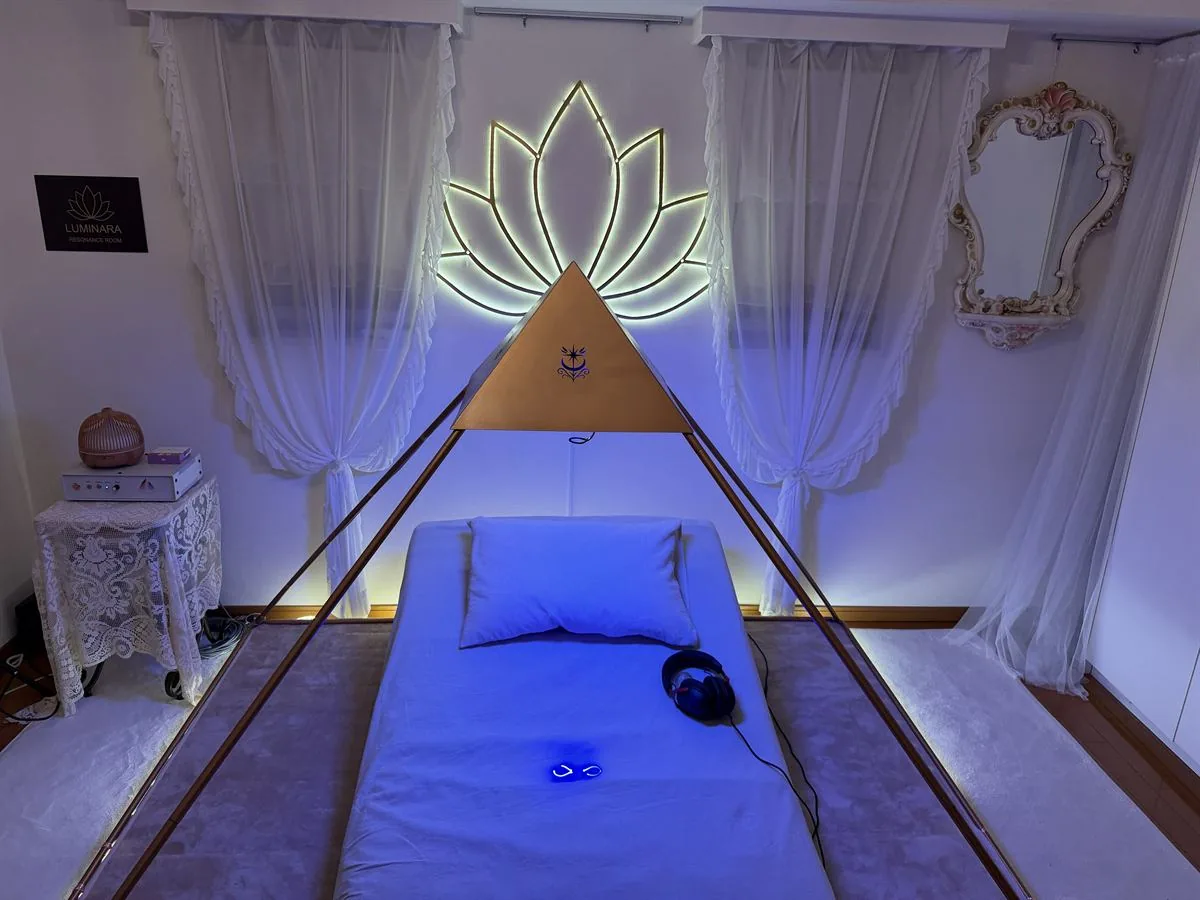
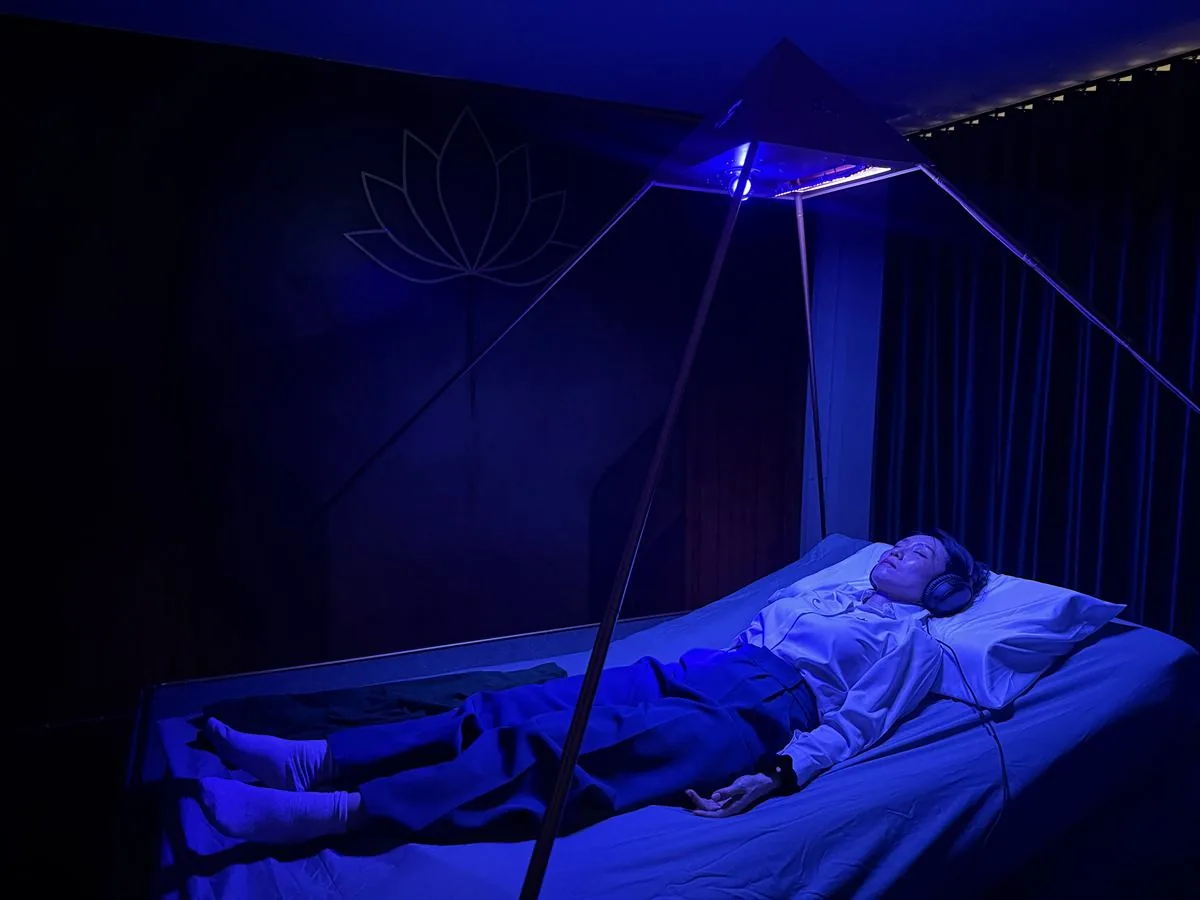
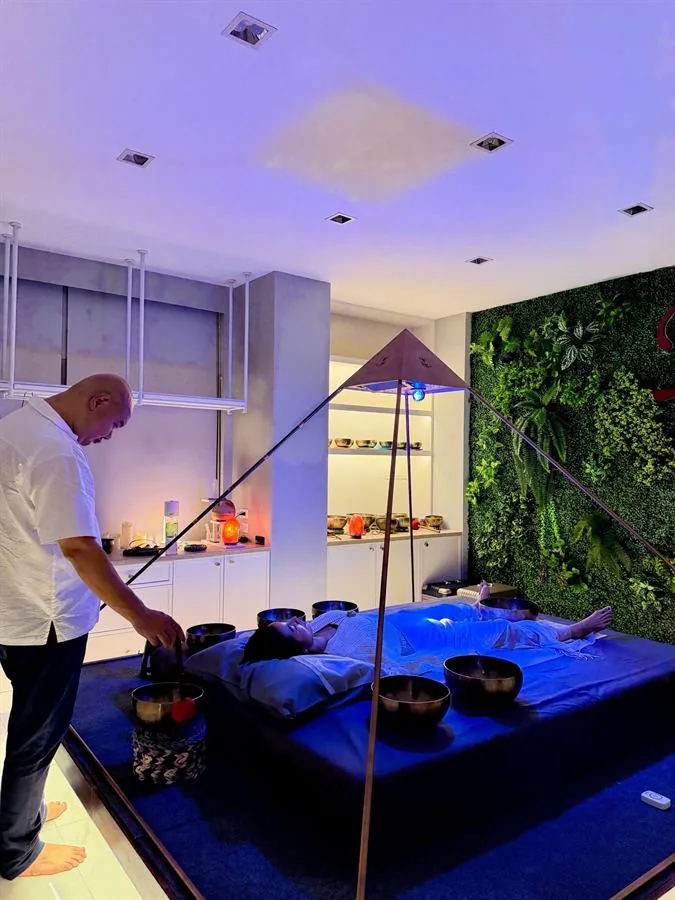
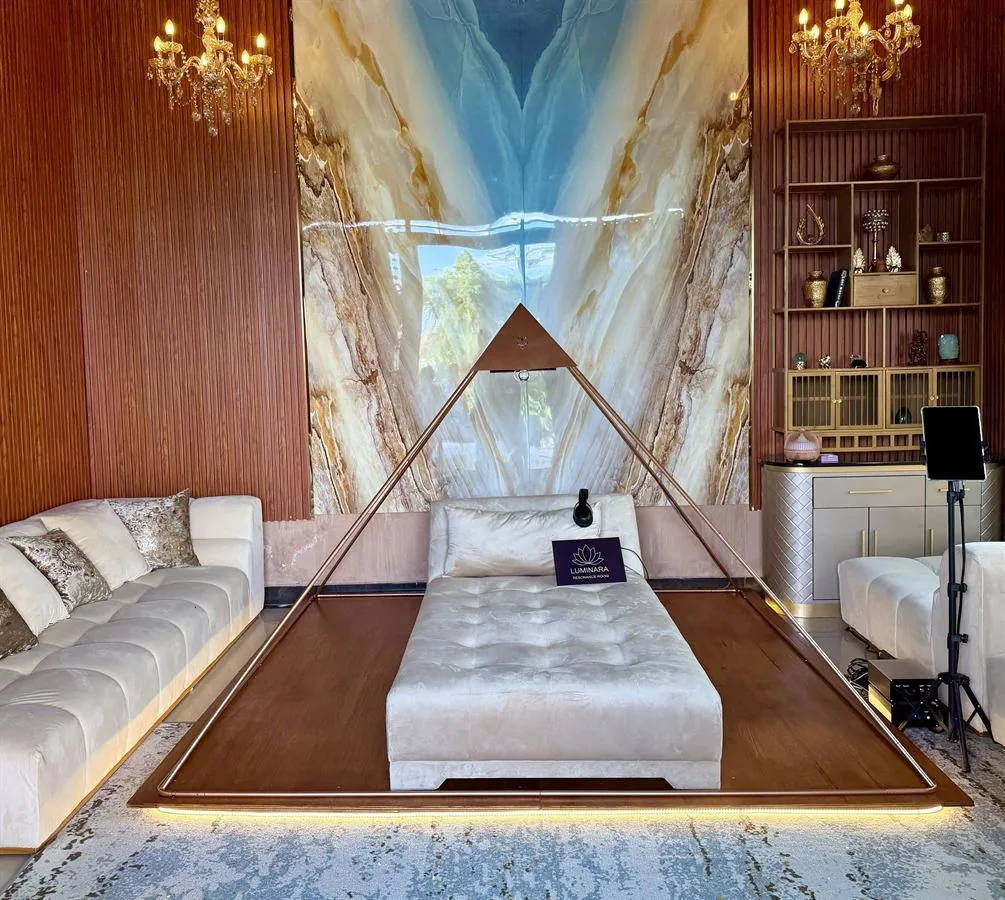
One Session. Seen from Every Angle.
Explore product details and distinct Luminara rooms already represented across the Light Mandalas website.
For business owners
Turn a Room into a Flagship Experience
Luminara brings together physical presence, multisensory immersion, center-ready storytelling, and practitioner guidance in a format designed to feel unmistakably different.
A guided sequence that can be trained, delivered, reviewed, and adapted by practitioners.
Includes Biomatrix Scan personalization and can connect with Mandala Scan, SoulSync, and other Light Mandalas tools.
A cinematic guest experience that gives the business a strong visual and emotional signature.
- Premium wellness centers
- Integrative practitioner environments
- Luxury spas and retreats
- Hospitality wellness suites
- Vitality rooms and recovery lounges
- Meditation and reflection spaces
- Private wellness residences
- Light Mandalas flagship experience rooms
Why operators build Luminara
- Create a signature booking reason
- Luminara gives a venue a room people can recognize, describe, photograph, and remember - a flagship experience rather than a menu item.
- Differentiate without medical positioning
- Offer a premium appointment-based wellness experience centered on relaxation, regulation, restoration, coherence, and sanctuary-like atmosphere.
- Give practitioners a repeatable pathway
- Optional scan insight, interpretation, session design, delivery, feedback, and adaptation create a clear operating rhythm.
- Build premium value over time
- The 78-code library, current center network, and demo pathway help owners tell a deeper story while keeping claims responsible.
The business opportunity is not only the hardware. It is the complete journey: a luminous room, a guided intake, an optional scan-informed pathway, a clear code sequence, and a quiet integration moment that guests can understand and return to.
Luminara is designed to help serious wellness operators create a high-value experience without relying on medical claims or guaranteed outcomes. The luxury comes from the atmosphere, the precision, the practitioner flow, and the sense that the room exists for one person at a time.
A Luminara planning conversation considers:
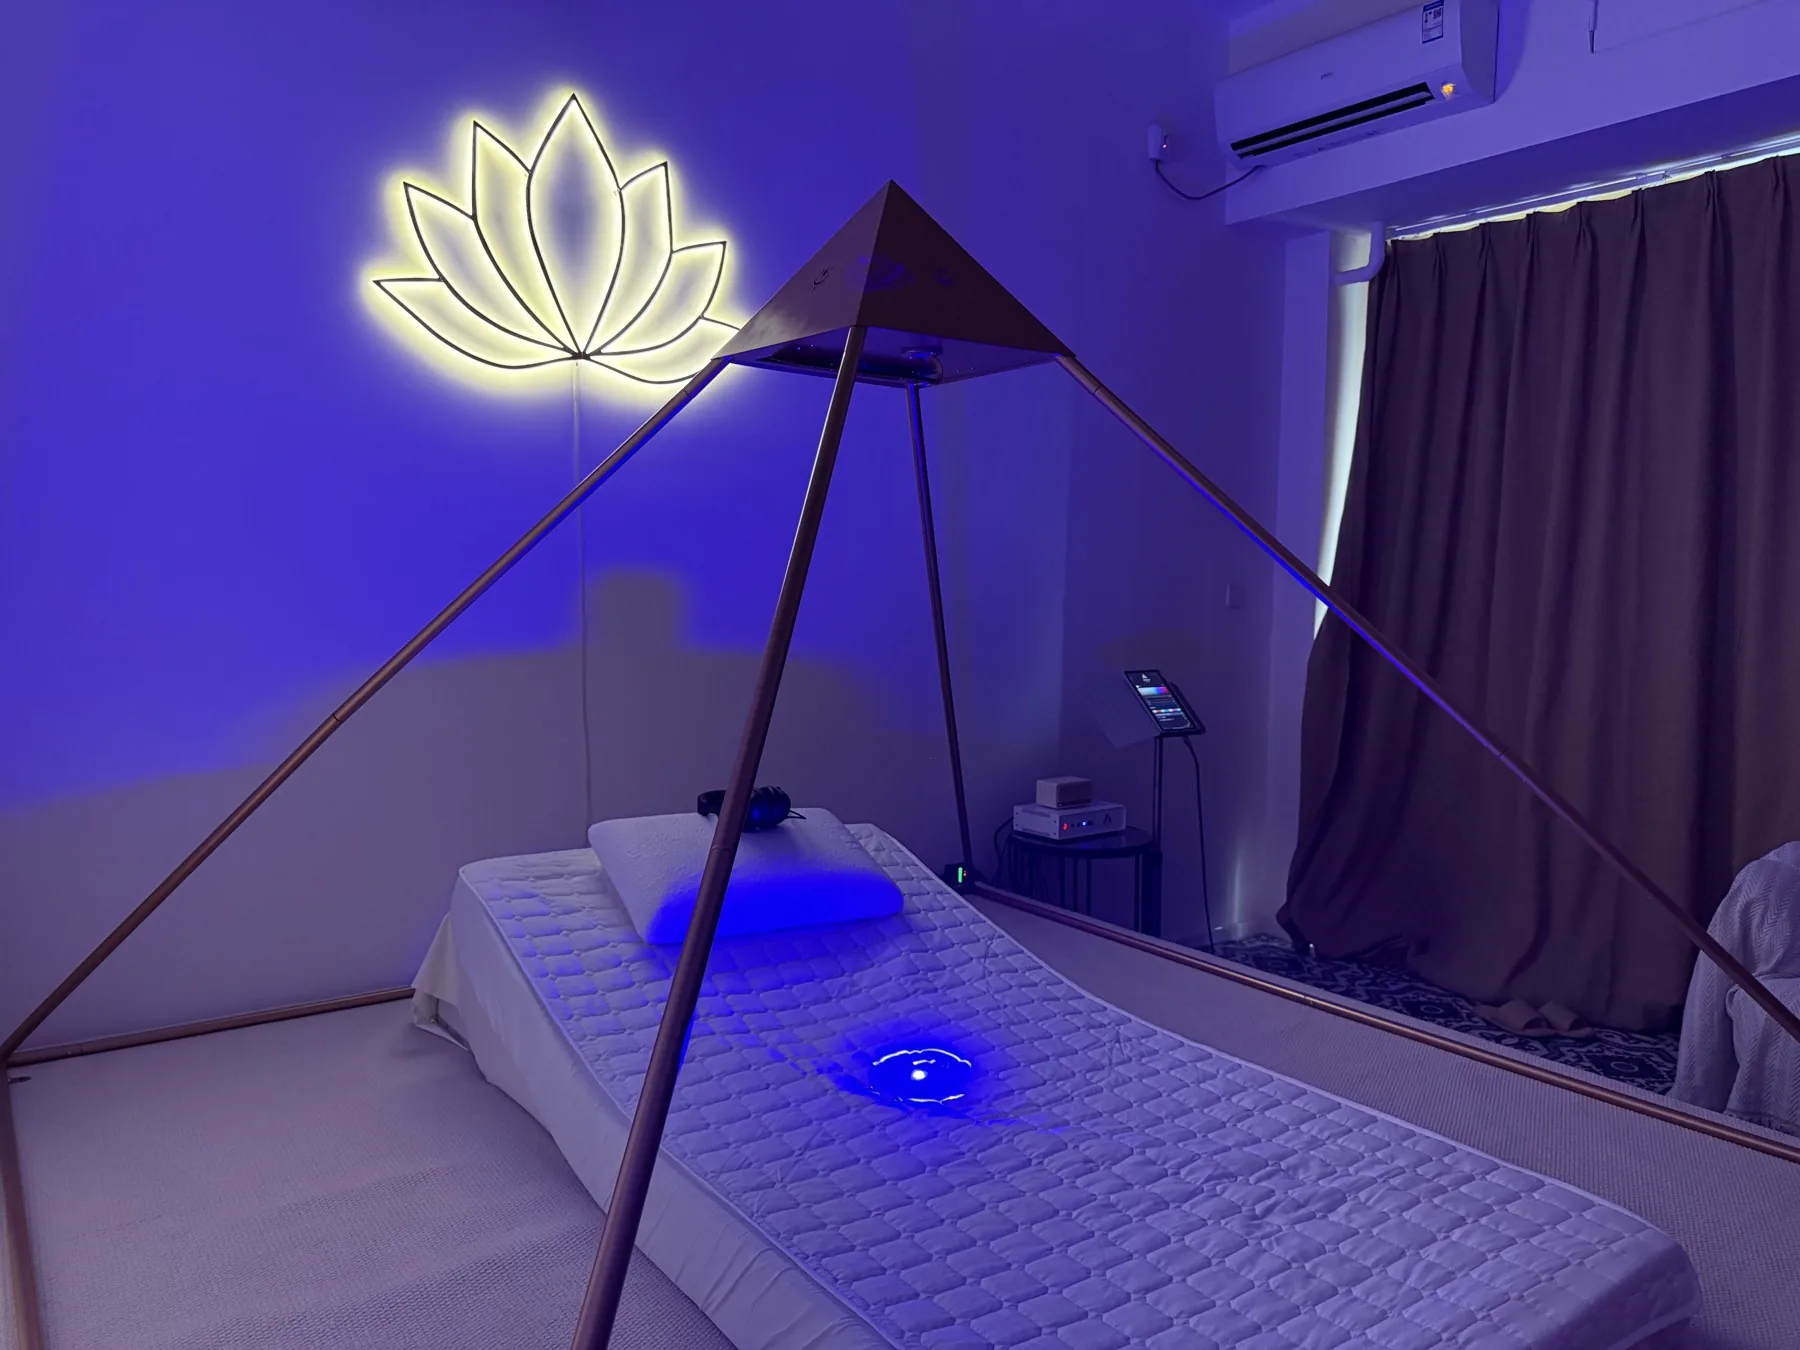
Luminara can become the experiential center of a thoughtfully designed room, with the structure, user flow, ambience, practitioner interface, and supporting technologies planned together. The standard pyramid is approximately 2.3 metres; final dimensions and layout vary according to installation and room configuration.
- Room dimensions, circulation, privacy, and guest comfort
- Pyramid scale and configuration for the intended environment
- Practitioner workflow and optional Biomatrix integration
- Session-control, supporting technologies, and operating context
- Atmosphere, lighting, bed layout, and post-session integration space
- Private ownership, professional use, or hospitality partnership goals
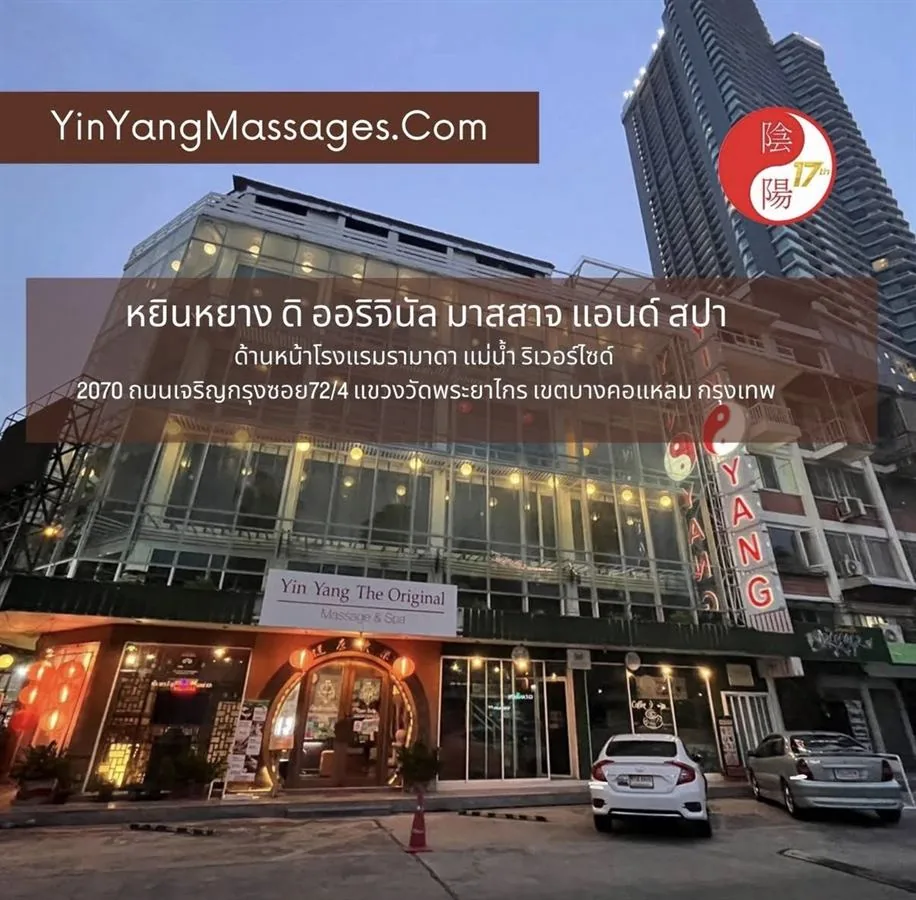
Luminara is already becoming a destination experience.
Evidence, scope & responsible positioning
A layered technology stack deserves layered evidence language.
Photobiomodulation & photonics
Red and near-infrared light interaction with biological systems is a stronger general research area. Luminara presents this as one layer inside a broader wellness architecture.
Electromagnetic resonance
Low-intensity field modulation and synchronization are explained as physical and sensory architecture, not as product-specific medical treatment.
Quartz optics & geometry
Quartz has known optical and piezoelectric properties. Luminara uses crystalline geometry as an optical interface and a symbolic design language.
Multi-modal entrainment
Light, sound, rhythm, breathing, and guided attention can be arranged into a coherent session environment that supports relaxation and focused awareness.
Scalar, torsion & biofield models
These concepts are treated as integrative frameworks and exploratory models. They should be presented with curiosity, not as settled clinical proof.
Designed for wellbeing—not medical diagnosis or treatment.
Light, sound, rhythm, relaxation, and autonomic-regulation principles have stronger general scientific foundations.
Product-specific multisensory and frequency applications are emerging or application-specific.
Bio-resonant, geometric, symbolic, biofield-informed, and subtle-field interpretations are integrative or theoretical unless supported by product-specific validation.
User experiences and practitioner observations vary and should never be presented as guaranteed outcomes.
Light Mandalas is not currently positioned as a medical diagnostic, treatment, cure, disease-prevention, or disease-management system. Luminara is presented as an immersive wellness and coherence-support experience for relaxation, emotional balance, autonomic regulation, restorative routines, focus, environmental harmony, and overall wellbeing. It should not be presented as a substitute for licensed medical care.
Before You Enter the Experience
Clear answers for private clients, practitioners, wellness centers, retreats, and hospitality partners.
What is the Luminara Pyramid?
Luminara Pyramid is the flagship immersive integration system within the Light Mandalas ecosystem. It coordinates sound, light, color, geometric projection, field-based technologies, grounding, guided voice, optional Biomatrix-informed personalization, and practitioner-led session design within one wellness environment.
What are the eight synchronized technologies?
The current presentation framework describes Bio-Resonant Codes, light modulation, RGB and near-infrared laser projection, coherence field antenna, low-intensity PEMF modulation, resonance field coils, grounding and integration, and functional voice guidance. These are presented as a coordinated wellness platform rather than independent medical therapies.
What happens during a session?
After arrival and settling, a practitioner may complete an optional Biomatrix Scan, interpret wellness priorities, and select a personalized session. The user then rests within the Luminara environment while the coordinated layers unfold, followed by grounding, feedback, and integration guidance.
How are sessions personalized?
Personalization considers the person's goals, sensitivity, current response, practitioner observations, and—where used—Biomatrix-informed guidance. AI-assisted logic can help organize suitable themes and codes, while the practitioner remains responsible for the session decision.
What are the 78 Bio-Resonant Codes?
They are 78 structured acoustic resonance programs inspired by biological and molecular references and translated into coordinated, wellness-oriented signal patterns. Public sessions organize them by functional themes rather than medical targets or biochemical claims.
Can I try a Bio-Resonant Code demo online?
Yes. The public Luminara Pyramid Demonstration is a five-minute, non-personalized audio-light experience that lets visitors understand the feeling of a simple code sequence. It is a wellness demonstration only and is not a substitute for a guided Luminara session.
Is Biomatrix a medical diagnosis?
No. Biomatrix is used as a wellness-oriented functional assessment to review patterns related to stress, recovery, adaptation, and regulation. It supports practitioner interpretation and does not diagnose organs, diseases, mental-health conditions, or biochemical deficiencies.
Does Light Mandalas have FDA approval?
Light Mandalas is not currently positioned as a medical diagnostic, treatment, cure, disease-prevention, or disease-management system. Luminara is designed and presented as a wellness technology and immersive coherence-support experience. Its intended role is to support relaxation, emotional balance, autonomic regulation, restorative routines, focus, environmental harmony, and overall wellbeing. It should not be presented as a substitute for licensed medical care. No blanket conclusion is made here about regulatory requirements for every component, use, market, or future configuration.
How long is a session?
Most sessions are approximately 20 to 40 minutes, depending on comfort, purpose, sensitivity, and practitioner guidance. The complete visit may also include arrival, optional assessment, and post-session integration time.
How often can Luminara be used?
Frequency is adapted to individual response, sensitivity, goals, and practitioner guidance. Deeper immersive sessions are generally introduced progressively, and first-time, sensitive, or depleted users may benefit from gentler pacing and more recovery time between sessions.
What might I feel during or after a session?
Some people notice calm, warmth, heaviness, lightness, mental quiet, emotional settling, groundedness, or restorative tiredness. Others experience subtler changes. Experiences vary, and no specific outcome is promised.
Can Luminara be installed in a spa, retreat, practitioner space, or private residence?
Yes. Luminara can be planned as a complete immersive wellness-room concept for professional hospitality and wellness settings or serious private environments. Dimensions, layout, user flow, and supporting technologies are considered in relation to the room.
Are there current Luminara Pyramid centers?
Yes. The Light Mandalas website maintains a current Luminara Pyramid Wellness Center directory with locations represented in Thailand, Indonesia, Japan, and China. The product page links to that directory for the latest public center details.
Why would a wellness center, retreat, or hospitality group build Luminara?
Luminara can give a venue a distinctive, appointment-based flagship experience that integrates physical space, multisensory technology, personalization, and practitioner guidance. It is designed to support differentiation through experience quality rather than medical promises or guaranteed commercial outcomes.
What does a Luminara room-planning conversation cover?
The discussion considers room dimensions, guest privacy and circulation, pyramid configuration, bed and atmosphere, practitioner workflow, optional Biomatrix integration, session-control technologies, intended audience, and whether the project is for private, professional, retreat, or hospitality use. Final scope depends on the installation.
Is Luminara a medical treatment?
No. Luminara is a wellness-support experience intended for relaxation, regulation, restoration, and coherence-oriented routines. It is not intended to diagnose, treat, cure, prevent, or manage disease and is not a substitute for licensed medical care.
How do I enquire about a Luminara system?
Contact Light Mandalas to discuss a private consultation, practitioner use, partnership opportunities, room planning, installation context, and the most appropriate next step for your setting.
Is Luminara the experience your space is missing?
Bring your room, audience, operating model, and wellness vision to a private planning conversation. Light Mandalas will help you explore whether a Luminara room fits your setting.
Luminara Pyramid is a wellness-support system intended for relaxation, regulation, restoration, and coherence-oriented experiences. It is not a medical diagnostic or treatment device and is not intended to diagnose, treat, cure, or prevent disease. It should not be considered a substitute for licensed medical care. Individual experiences may vary.